TransitFlow
Visualize scheduled transit frequency and vehicle counts around the world.
About
TransitFlow is an experimental set of tools to generate animated transit maps and vehicle counts based on scheduled frequency.
TransitFlow consists of two parts:
- A python script to retrieve and wrangle transit schedule data from Transitland, an open data service sponsored by Mapzen that aggregates public transportation data from around the world. Transitland enables us to merge transit schedules from different operators without having to interact directly with each operator’s GTFS data.
- A template to generate a Processing sketch to animate that data.
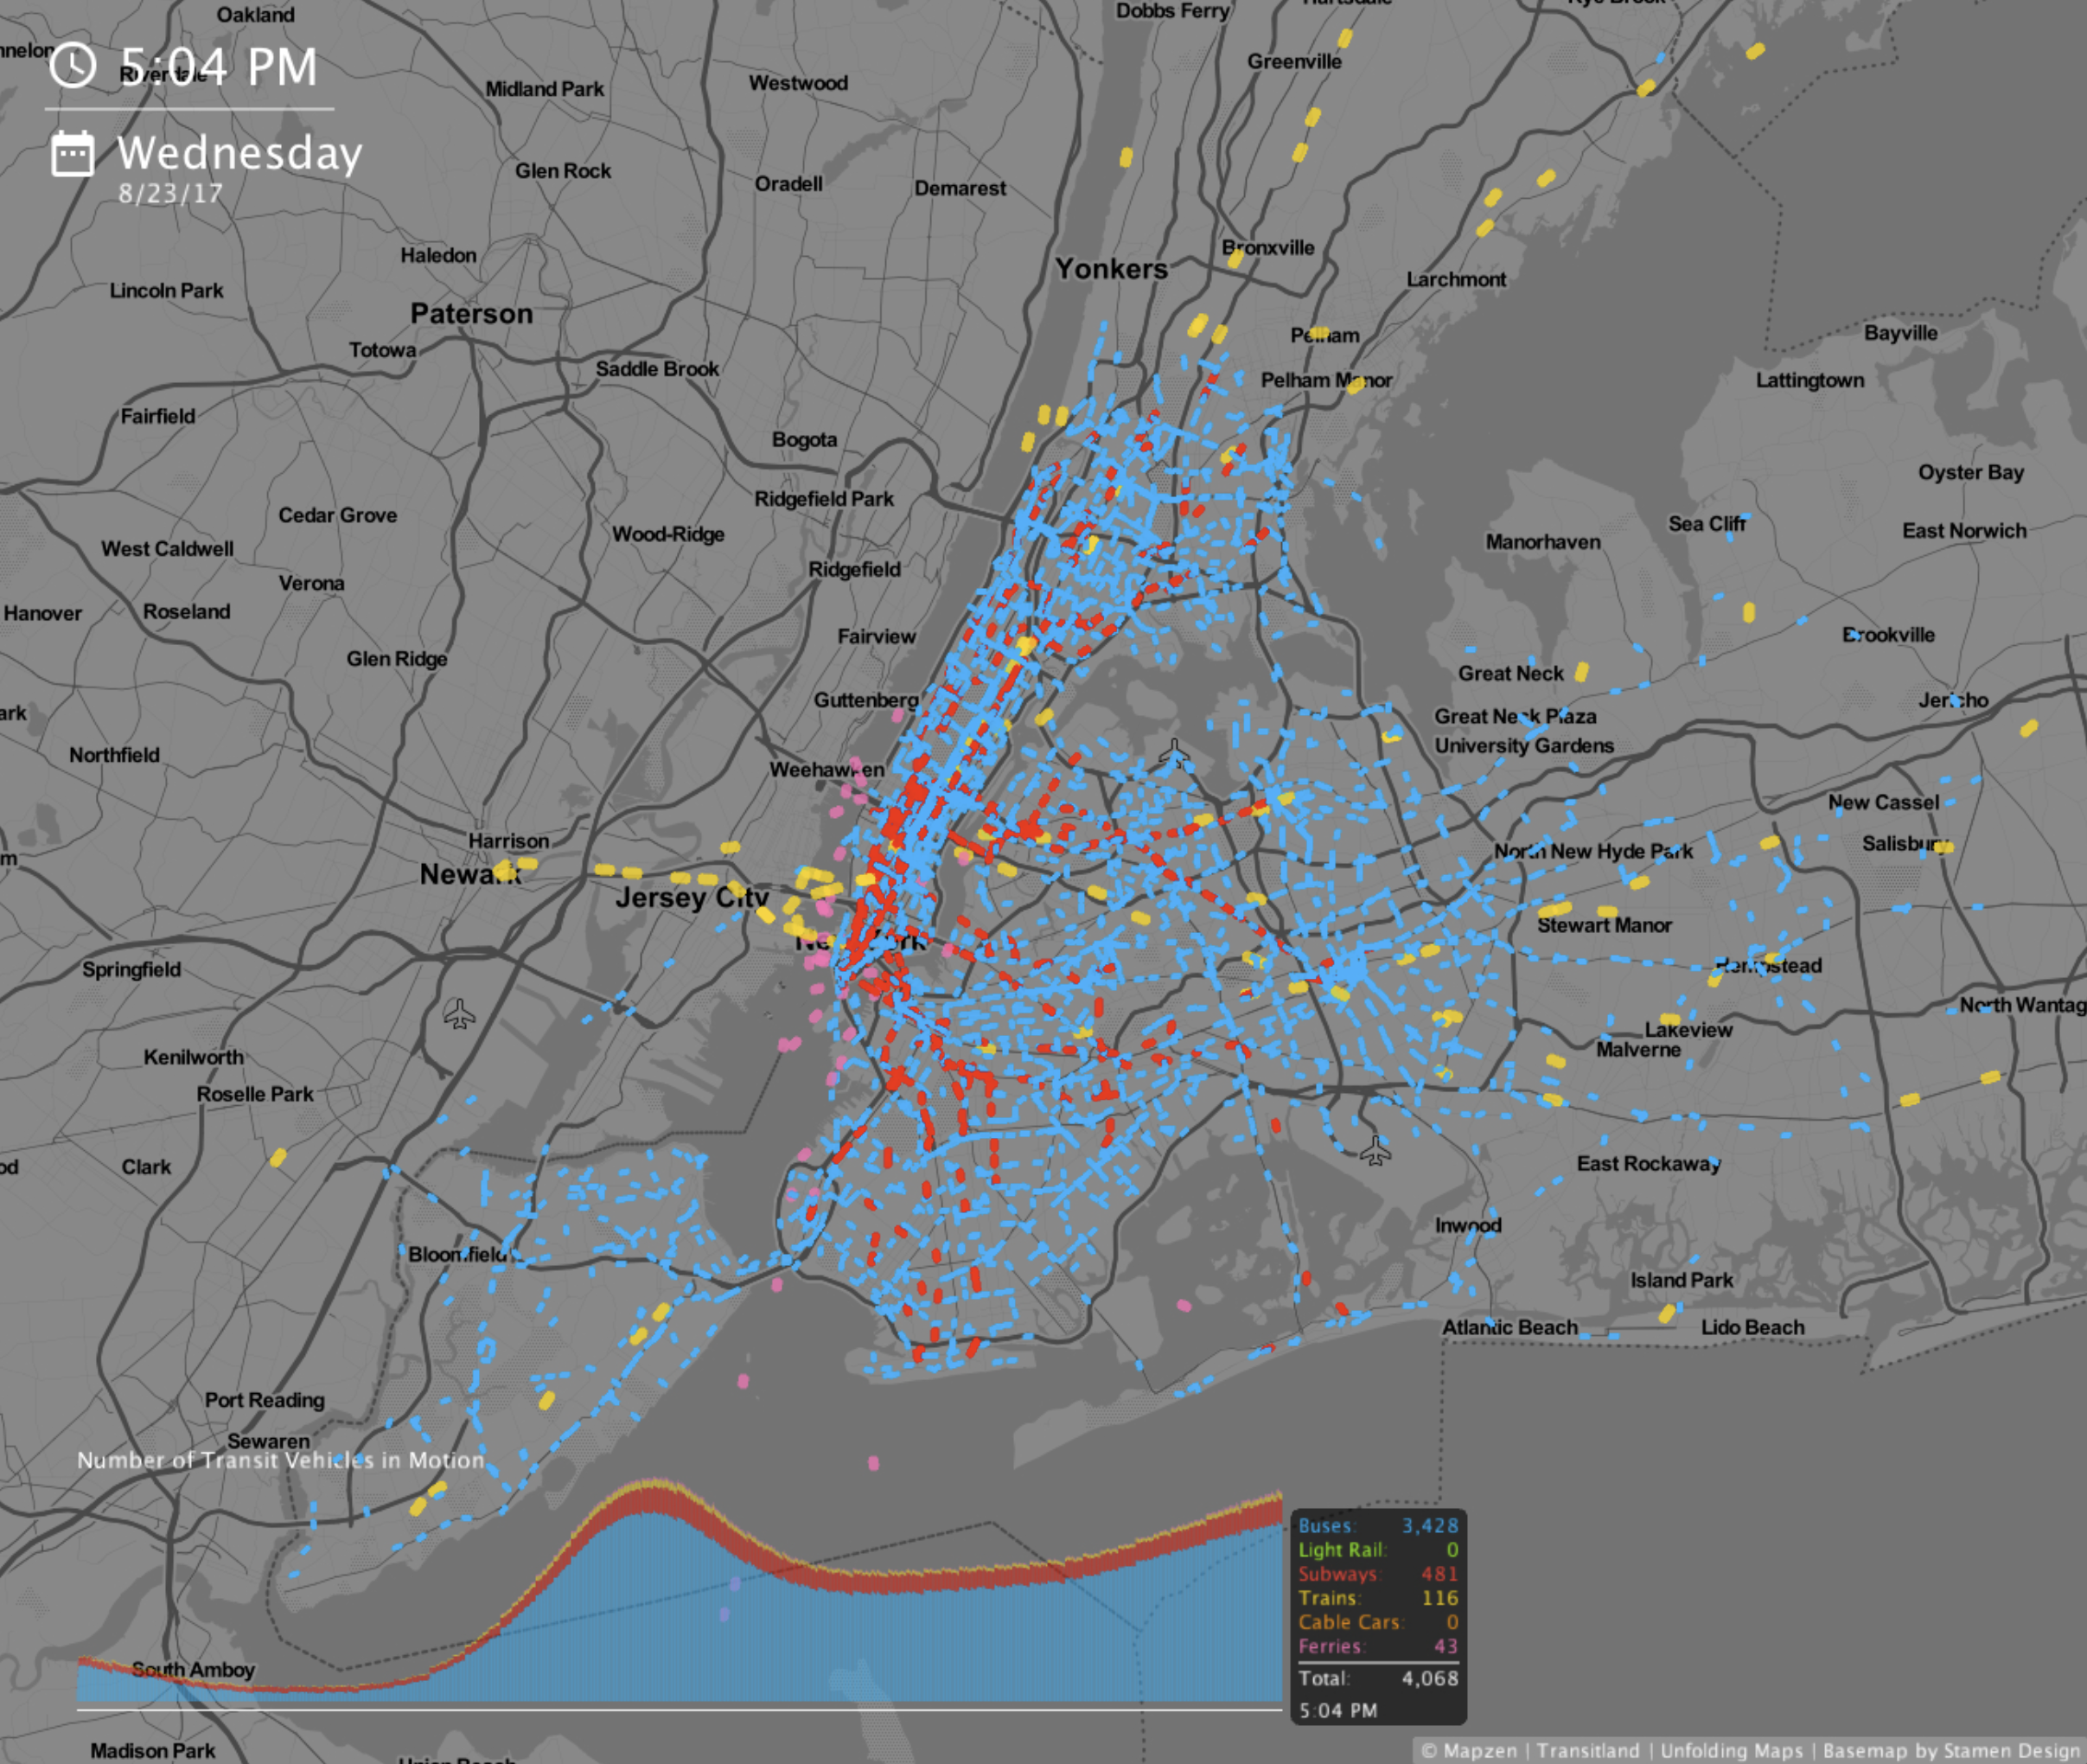
Let’s look at a few examples of what you can do with TransitFlow.
Examples
Bay Area
python transitflow.py --name=bay_area --bbox=-123.280334,37.011326,-120.607910,38.955137 --clip_to_bbox
San Francisco
python transitflow.py --name=san_francisco --bbox=-122.515411,37.710714,-122.349243,37.853983 --clip_to_bbox
Chicago
python transitflow.py --name=chicago --bbox=-87.992249,41.605175,-87.302856,42.126747 --clip_to_bbox
Mexico City
python transitflow.py --name=mexico_city --bbox=-100.041504,18.453557,-97.701416,20.040450 --clip_to_bbox --date=2016-06-01
Many more examples available here.
How it Works
Getting the Data
TransitFlow makes use of three Transitland API endpoints to get the data:
- Stops to get transit stop locations
- Routes to get operator vehicle types
- ScheduleStopPairs to get origin -> destination schedule stop pairs
Visualizing the Data
TransitFlow generates a Processing sketch file based on your command line arguments. The Processing sketch reads in the CSV file from the previous step, uses the Unfolding Maps library to load map tiles and convert geolocations into screen positions, and animates vehicle movements from origin stop to destination stop using linear interpolation. Note, that we are animating between stops and not yet following the exact route line.How to Use It
First, navigate to the github repository and follow the relatively painless set-up instructions.
You can visualize a single transit operator by passing in the operator’s Onestop ID as a command line argument.
What’s a Onestop ID, you ask? As part of Transitland’s Onestop ID Scheme, every transit operator, route, feed and stop are assigned a unique identifier called a Onestop ID. You may look up an operator’s Onestop ID using the Transitland Feed Registry.
For example, the onestop ID for San Francisco BART is o-9q9-bart.
To visualize BART’s schedule on today’s date:
python transitflow.py --name=bart --operator=o-9q9-bart
You can also visualize many operators within a region by passing in your bounding box of interest as a command line argument. I like using bboxfinder to draw a bounding box. The bounding box must be in the format: West, South, East, North. For example, to visualize Portland transit flows on today’s date:
python transitflow.py --name=portland --bbox=-123.035889,45.257489,-122.250366,45.798170 --clip_to_bbox
To view your transit visualization, navigate to sketches\{name}\{date}\sketch and open the sketch.pde file. This should open the Processing application. Simply click the play button or command + r to run the animation.
Command line arguments
| Key | Status | Description | Example |
|---|---|---|---|
| --name | required | The name of your project | --name==Boston |
| --date | optional | Defaults to today's date | --date=2017-08-25 |
| --operator | optional | Operator onestop_id | --operator=o-drt-mbta |
| --bbox | optional | West, South, East, North | --bbox=-71.4811,42.1135,-70.6709,42.6157 |
| --clip_to_bbox | optional | Clip results to bounding box | --clip_to_bbox |
| --exclude | optional | Operators to be excluded | --exclude=o-9-amtrak |
| --apikey | optional | Mapzen API key | --apikey=mapzen-abc1234 |