Taxi Trips in Beijing
Animating taxi trajectory data collected in Beijing
About
This project represents my attempt to visualize a "bird's eye view" of Beijing taxi flows using publicly available data.
The underlying data was collected and made public by Microsoft Research.
Methodology:
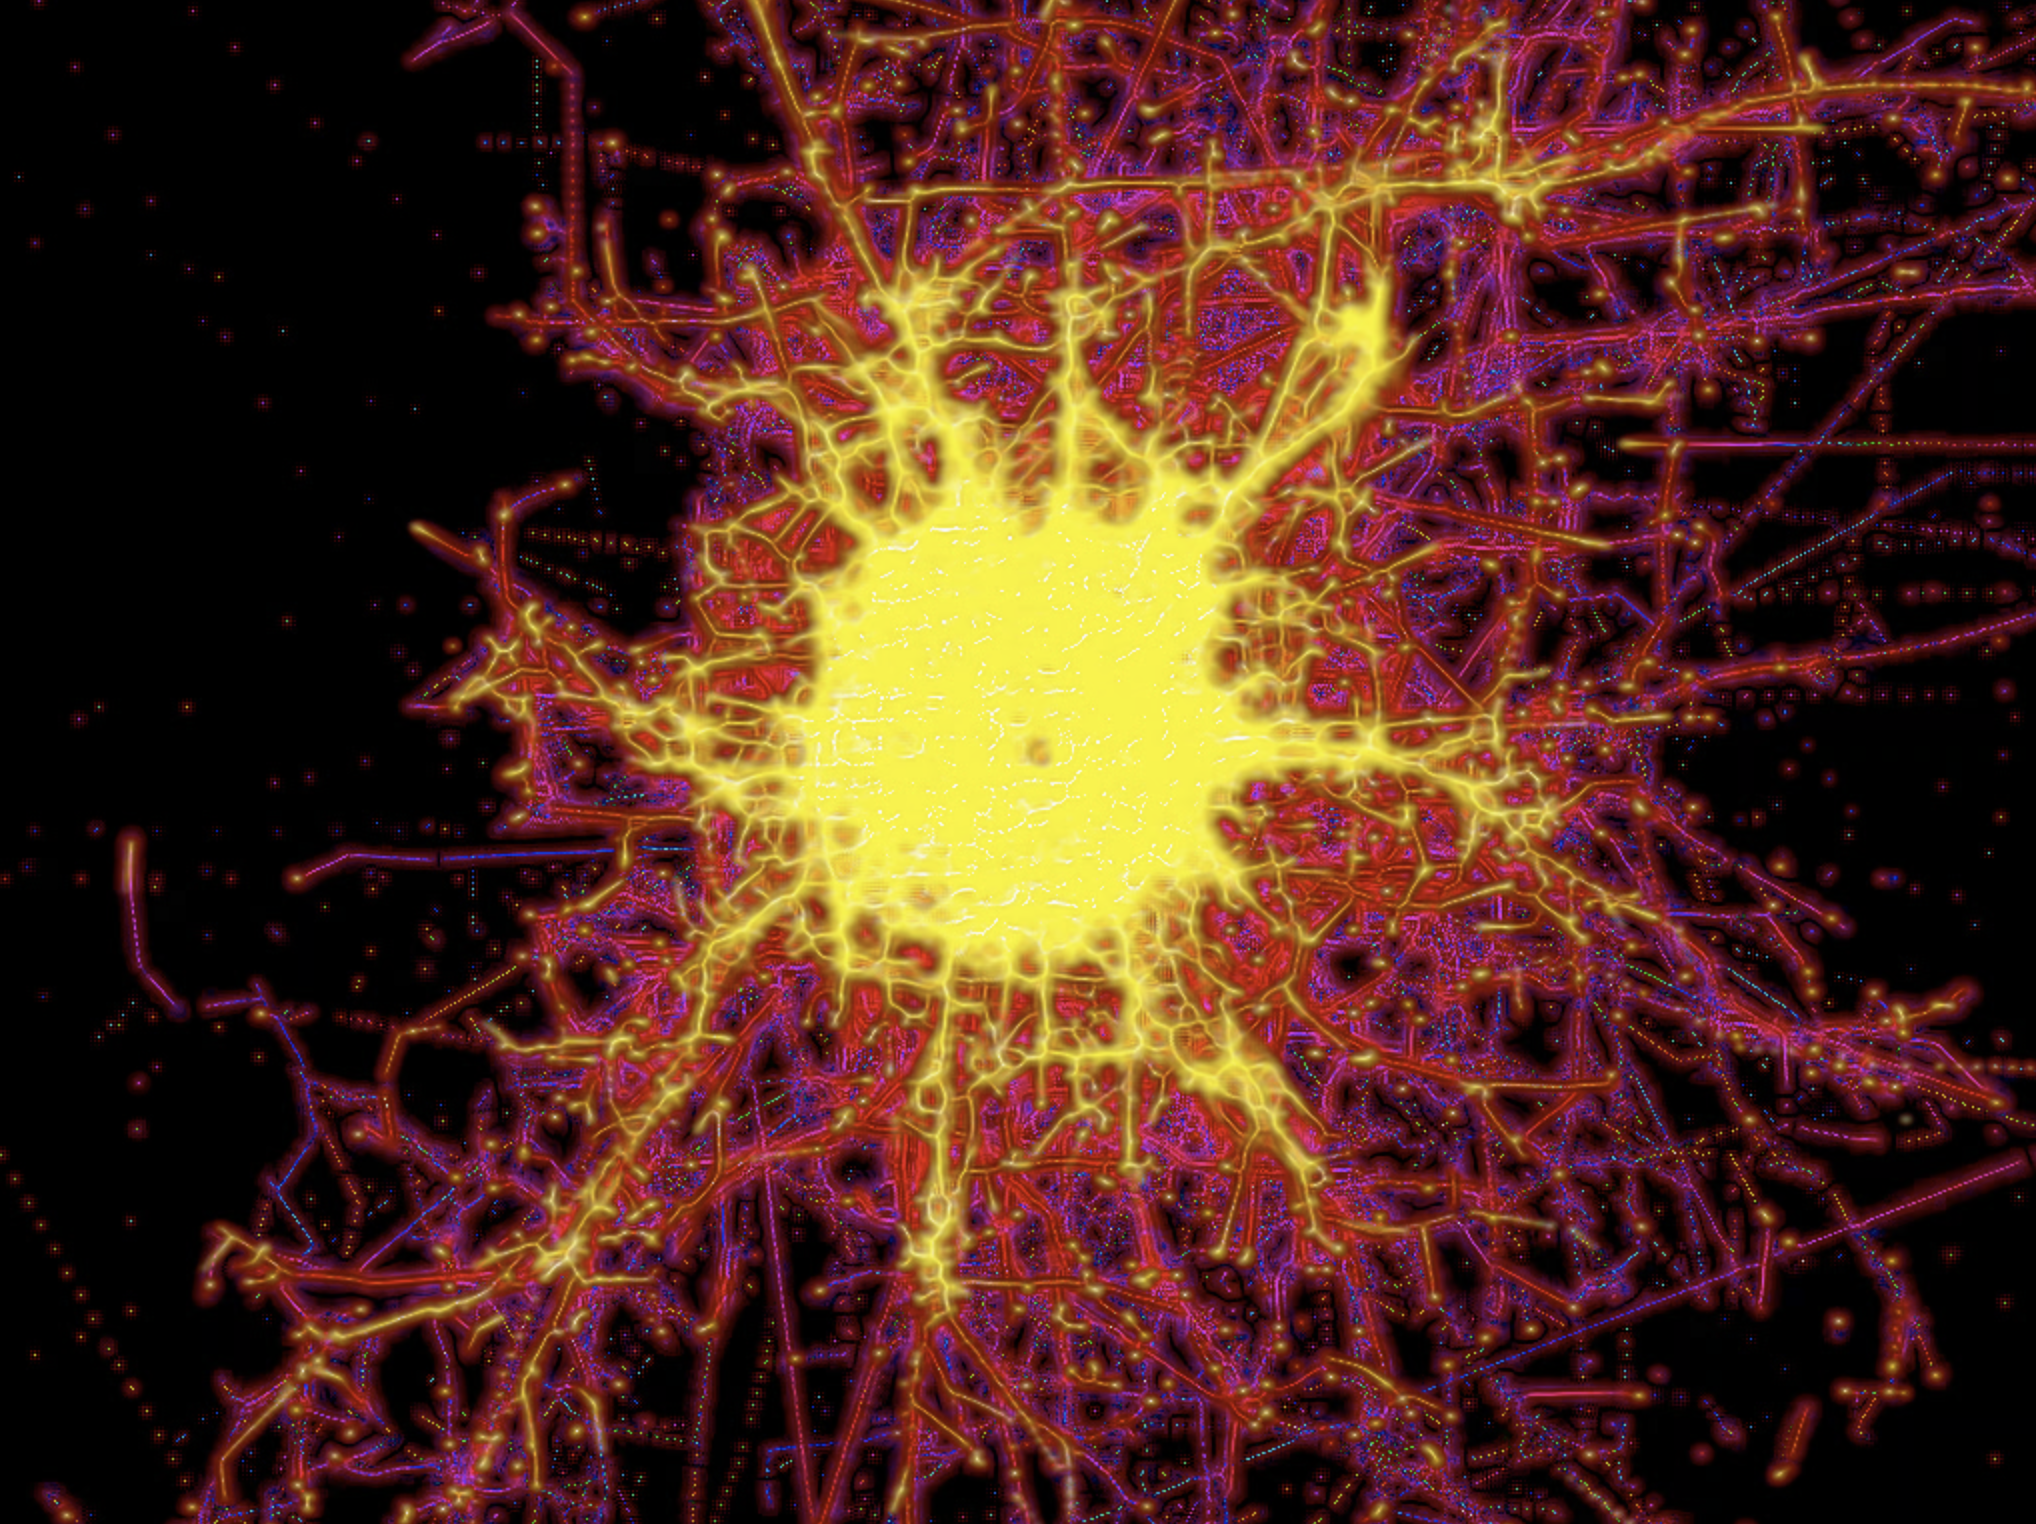
I downloaded the Beijing taxi trajectory data from Microsoft Research and selected just one day to visualize. I wrote a python script to parse the data into a table, relying heavily on the GeoPandas library.
I then wrote an application using OpenFrameworks (C++) to visualize the data. Here is a video showing the animation created with openFrameworks:
I then wanted to add a blur effect, so that the visualization would resemble flame (rather than displaying individual dots moving). So, I used Touchdesigner to apply a GLSL filter. Here is the video showing the animation after post-processing in TouchDesigner:
Tools used: Python, openFrameworks (C++), TouchDesigner