When does crime happen in New York City?
In NYC, more robberies happen right when school gets out than any other time.
I was inspired by this post on the fantastic blog I Quant NY. Author Ben Wellington analyzes the NYPD Major Felony Incidents data set provided by NYC Open Data. The below analysis will recreate Ben’s work using the Python programming language and even take it a bit further.
You may view my complete notebook here.
Set up the environment
Import the necessary libraries.
from datetime import datetime
import matplotlib.pyplot as plt
import matplotlib.dates as mdates
import numpy as np
import os
import pandas as pd
import seaborn as sns
import time
%matplotlib inline
Load the raw data
Download the csv directly from the NYC Open Data site and load it into a data frame.
url = 'https://data.cityofnewyork.us/api/views/hyij-8hr7/rows.csv?accessType=DOWNLOAD'
raw_data = pd.read_csv(url)
Preview the data frame and see what dtypes the columns are.
raw_data.head()
raw_data.dtypes
Clean the data
Select years 2006 through 2015 into new data frame.
df = raw_data[(raw_data['Occurrence Year'] >= 2006) & (raw_data['Occurrence Year'] <= 2015)].copy()Convert columns in dataframe to the appropriate types.
# Convert floats to integers
df['OBJECTID'] = df['OBJECTID'].fillna(0).astype(int)
df['Occurrence Day'] = df['Occurrence Day'].fillna(0).astype(int)
df['Occurrence Year'] = df['Occurrence Year'].fillna(0).astype(int)
df['Occurrence Hour'] = df['Occurrence Hour'].fillna(0).astype(int)
df['CompStat Month'] = df['CompStat Month'].fillna(0).astype(int)
df['CompStat Day'] = df['CompStat Day'].fillna(0).astype(int)
df['CompStat Year'] = df['CompStat Year'].fillna(0).astype(int)
df['Precinct'] = df['Precinct'].fillna(0).astype(int)

# Convert categorical columns to categories
df['Offense'] = df['Offense'].astype('category')
df['Offense Classification'] = df['Offense Classification'].astype('category')
df['Sector'] = df['Sector'].astype('category')
df['Precinct'] = df['Precinct'].astype('category')
df['Borough'] = df['Borough'].astype('category')

# Convert Occurence Date column to datetime
df['Occurrence Date'] = pd.to_datetime(df['Occurrence Date'])
df.dtypes
Sort data frame by Occurrence Date and then reset the index using reset_index
df.sort('Occurrence Date', inplace=True)
df.reset_index(drop=True, inplace=True)
What times of day do major felonies happen?
groupby Occurrence Hour and Offense. count() the number of rows.
offense_by_hour = df['Occurrence Date'].groupby([df['Occurrence Hour'], df['Offense']]).count().unstack()
offense_by_hour.head()
plot number of crimes grouped by Occurrence Hour and Offense type.
offense_by_hour.plot(figsize=(10,8), title='Absolute Number of Crimes per Hour by Offense')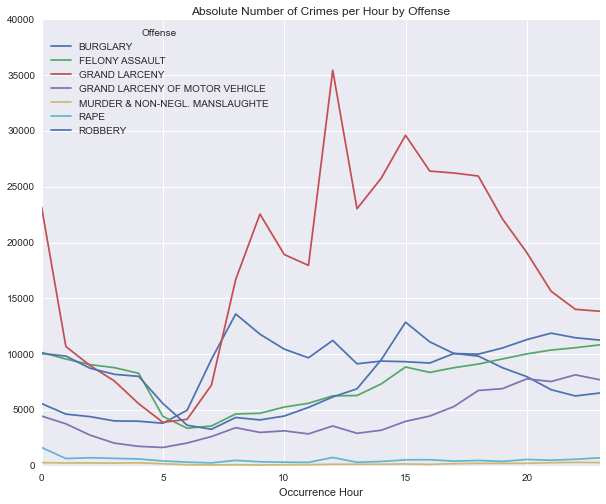
Nice! We’re starting to get somewhere. The chart above shows the absolute number of Crimes by hour over the 2006-2015 period. However, we want to see the hourly crime rate rather than the absolute number of crimes. So, we need to divide this the grouped data frame by the number of days in the time period to get the hourly crime rates that we want.
# Calculate number days in 2006-2015
first_day = df['Occurrence Date'][2]
last_day = df['Occurrence Date'].max()
delta = last_day - first_day
days = delta.days-1
print "# of days in time period:", days
Convert the absolute number of crimes to hourly rates by dividing by the number of days in the period.
crime_rate_hourly_by_offense = offense_by_hour.div(days)
crime_rate_hourly_by_offense.plot(figsize=(10,8), title='Hourly Felony Rate in NYC, 2006-2015');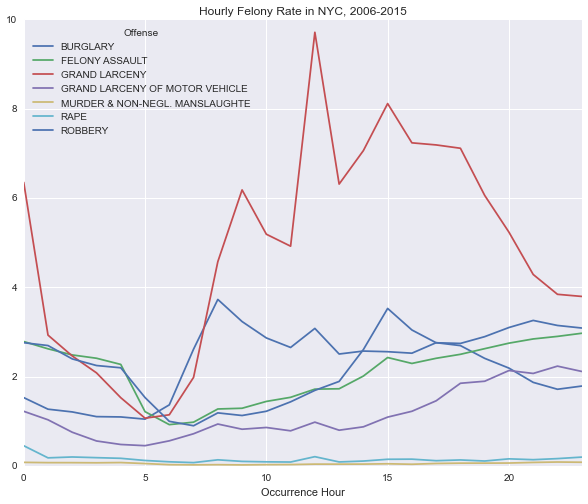
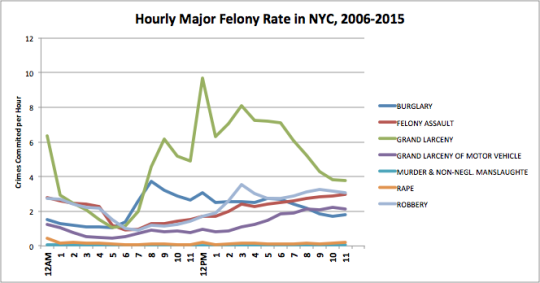
This matches up nicely with Ben’s chart:
It appears that there are peaks around midnight and noon. There are also peaks around 8am and 3pm. This happens to be approximately when school starts and gets out in New York.
Is it possible that school getting out is responsible for higher crime rates? Let’s dig deeper to find out.
Let’s segment school days from non-school days to tease out the effect of school hours on crime rates. Specifically, categorize each day as a school day, summer vacation, weekday holiday or weekend day. To pinpoint the weekday holidays I referred to this NYC school calendar.
PROBLEM: Only the 2015-2016 academic calendar is available here. So, I make the obviously flawed assumption that the academic recesses and holidays occurred on the same dates in 2006 through 2014 as they did in 2015. Ben also created his school ‘vacation weekday’ sub- data set. It’s unclear exactly how he made it, so I’ll make this assumption for now and move forward with the analysis and ask him :) .
Do crime rates increase when school gets out?
In order to tease out crime trends on school days, I want to categorize each day from 2006 to 2015 as either a 1) School Day, 2) Weekday Holiday, 3) Weekend or 4) Summer Vacation.
In order to do so I’ll need to insert a Date column into the dataframe that is simply a date (rather than a datetime stamp).
# Calculate number days in 2006-2015
# Set datetime to simply date value (we may need this later)
df['Date'] = df['Occurrence Date'].dt.date
# Create Month-Day column to store a (Month, Day) tuple in order to compare month-days
df['Month-Day'] = zip([date.date().month for date in df['Occurrence Date']],df['Occurrence Day'])# I made a CSV of school year holidays in 2015-2016 per http://schools.nyc.gov/Calendar/default.htm
holidays = pd.read_csv('C:/Users/Will/Desktop/2015_holidays.csv')
holidays['Date'] = pd.to_datetime(holidays['Date'])
holidays['Month'] = [date.date().month for date in holidays['Date']]
holidays['Day'] = [date.date().day for date in holidays['Date']]
holidays['Month-Day'] = zip(holidays.Month, holidays.Day)
holidays.head()I created a csv of school year holidays in 2015-2016 per http://schools.nyc.gov/Calendar/default.htm
holidays = pd.read_csv('C:/Users/Will/Desktop/2015_holidays.csv')
holidays['Date'] = pd.to_datetime(holidays['Date'])
holidays['Month'] = [date.date().month for date in holidays['Date']]
holidays['Day'] = [date.date().day for date in holidays['Date']]
holidays['Month-Day'] = zip(holidays.Month, holidays.Day)
holidays.head()Indicate whether days are Summer, Weekend, Weekday Holiday or School Days using 1’s and 0’s.
# Set summer vacation = 1 where month is July, August or September (and before Sept 9)
df['Summer Vacation'] = np.where((df['Occurrence Month'] == 'Jul') | (df['Occurrence Month'] =='Aug')
                                 | ((df['Occurrence Month'] == 'Sep') & (df['Occurrence Day'] < 9)),1,0)

# Set weekend day = 1 where day is Saturday or Sunday
df['Weekend Day'] = np.where(((df['Day of Week'] == 'Saturday') | (df['Day of Week'] == 'Sunday')),1,0)

# Set weekday holiday = 1 if the month-day was a holiday in 2015. This assumes month-day holidays will be same in other years
df['Weekday Holiday'] = [1 if monthday in list(holidays['Month-Day']) else 0 for monthday in df['Month-Day']]

# Set school day = 1 if none of the previous three new columns are = 1
df['School Day'] = np.where((df['Summer Vacation'] != 1) & (df['Weekend Day'] != 1) & (df['Weekday Holiday'] !=1),1,0)
Set Day Type equal to the correct type of day.
def day_type(row):
    if row['Summer Vacation'] == 1:
        return 'Summer Vacation'
    if row['Weekend Day'] == 1:
        return 'Weekend Day'
    if row['Weekday Holiday'] == 1:
        return 'Weekday Holiday'
    if row['School Day'] == 1:
        return 'School Day'

df['Day Type'] = df.apply(lambda row: day_type(row), axis=1)

# Convert Day Type column to categorical
df['Day Type'] = df['Day Type'].astype('category')
Plot Hourly Felony Rate in NYC by day type.
crimes_by_day_type = df['Occurrence Date'].groupby([df['Occurrence Hour'], df['Day Type']]).count().unstack()
crime_rate_hourly_by_day_type = crimes_by_day_type.div(days)
crime_rate_hourly_by_day_type.plot(figsize=(10,8), title='Hourly Felony Rate in NYC is Higher on School Days');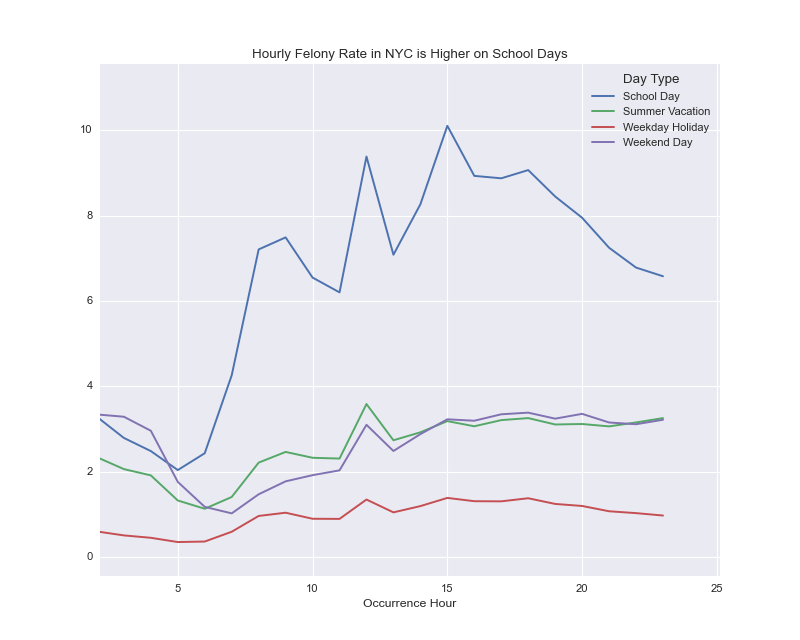
You can see that the overall level of felonies is much higher on school days than holiday or weekend days. Let’s dive deeper and segment this analysis across the various types of offenses. We’ll want to calculate two things:
- Number of crimes
- Rate of crimes
And segment them across three attributes:
- Day Type: school day, summer vacation, weekday holiday, weekend day
- Offense Type: burglary, felony assault, grand larceny, grand larceny of motor vehicle, murder, rape and robbery
- Occurrence Hour: hourly from 12am through 11pm
If we were working in Excel, this would be pretty time intensive. Thankfully Python’s groupby and aggregate functions can take care of this pretty easily. Below we define an aggregation to count the number of occurrences. Then, we group the data frame by Offense, Occurrence Hour and Day Type and apply the aggregation. Finally, we divide the ‘hourly_rate’ aggregation by the appropriate number of days for each day type to convert crime counts into crime rates.
# Define the aggregation calculations
aggregations = {
    'OBJECTID': { # work on the "OBJECT ID" column
        'num_occurrences': 'count',  # get the count, and call this result 'num_occurences'
        'hourly_rate': 'count'} # placeholder for now - we will divide this by number of days next
    }

# Perform groupby aggregation by occurrence hour and day type
g = df.groupby([df['Offense'].astype('str'), df['Occurrence Hour'], df['Day Type']]).agg(aggregations).unstack()

# Divide the hourly_rate columns by the appropriate number of days to convert them into hourly rates
g[('OBJECTID', 'hourly_rate', 'School Day')] = g[('OBJECTID', 'hourly_rate', 'School Day')] / school_days
g[('OBJECTID', 'hourly_rate', 'Summer Vacation')] = g[('OBJECTID', 'hourly_rate', 'Summer Vacation')] / summer_days
g[('OBJECTID', 'hourly_rate', 'Weekday Holiday')] = g[('OBJECTID', 'hourly_rate', 'Weekday Holiday')] / weekday_holidays
g[('OBJECTID', 'hourly_rate', 'Weekend Day')] = g[('OBJECTID', 'hourly_rate', 'Weekend Day')] / weekend_days
g.head()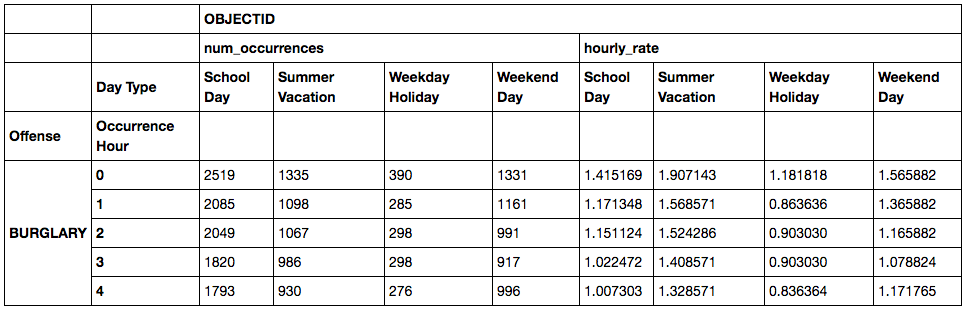
for x in np.unique(g.index.get_level_values(0)):
    print x
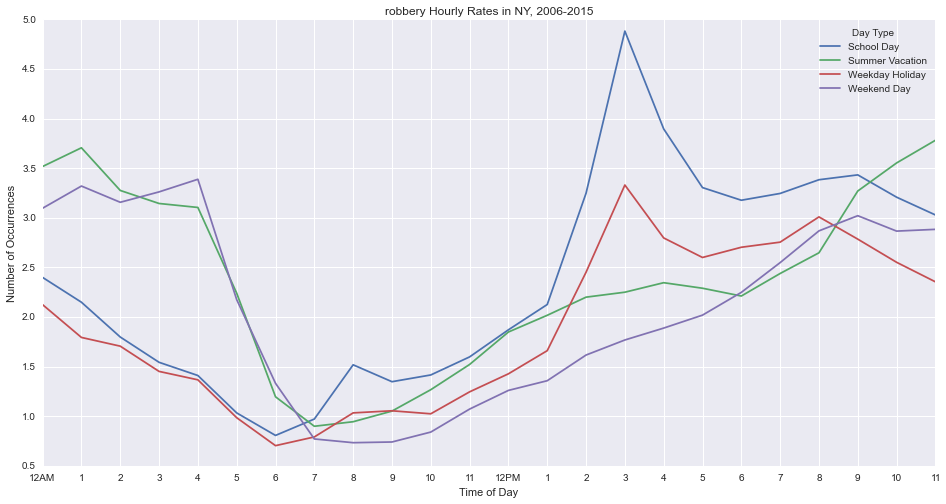
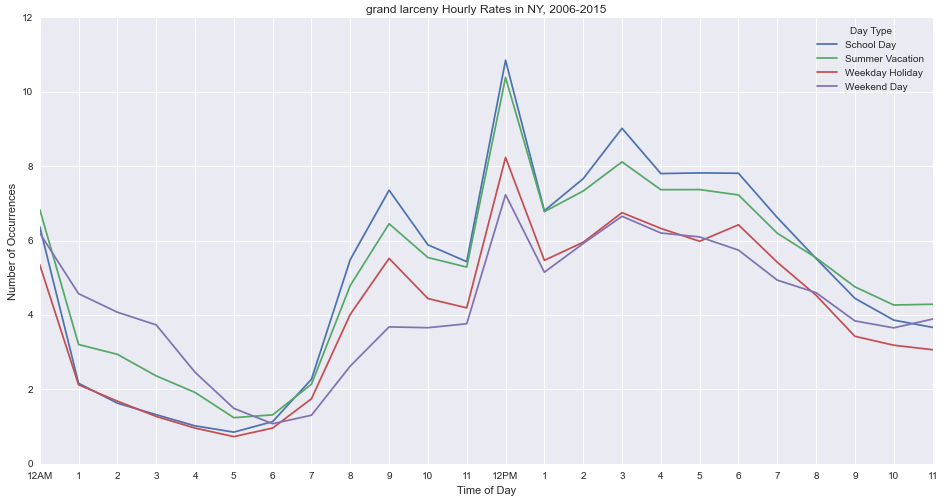
Make a plot for each type of offense.
for x in np.unique(g.index.get_level_values(0)):
ax = plt.figure()
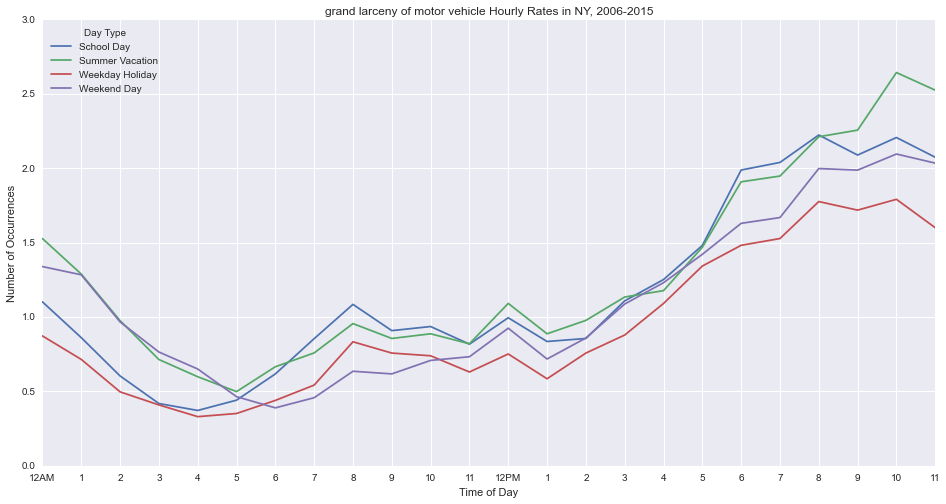
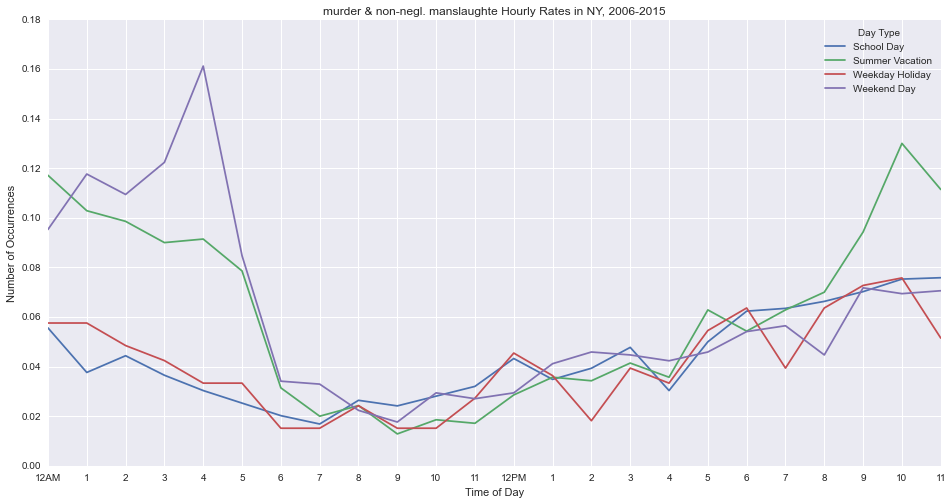
g.loc[x,('OBJECTID', 'hourly_rate')].plot(figsize=(16,8), title=x.lower() + ' Hourly Rates in NY, 2006-2015')
hours = ['12AM', 1, 2, 3, 4, 5, 6, 7, 8, 9, 10, 11, '12PM', 1, 2, 3, 4, 5, 6, 7, 8, 9, 10, 11]
plt.xticks(range(len(hours)), hours)
plt.ylabel('Number of Occurrences')
plt.xlabel('Time of Day')Robbery peaks on school days at 3pm, right when school gets out.
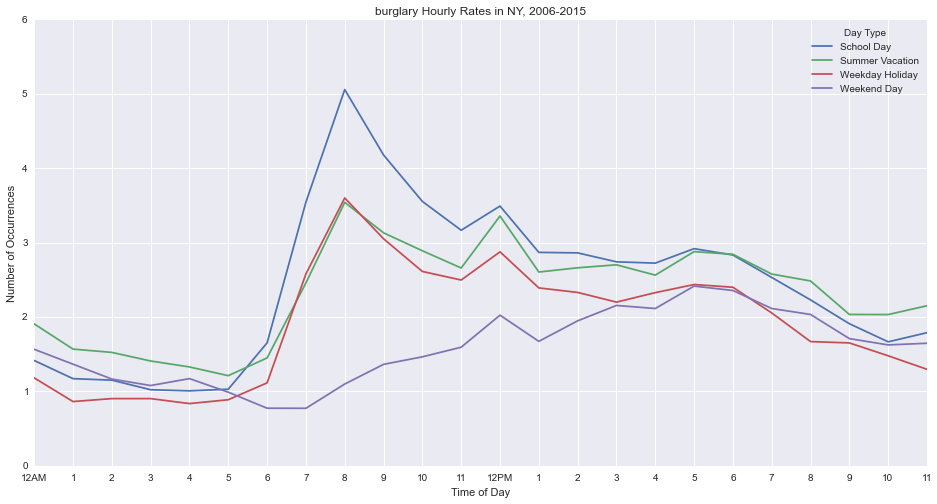
Burglary peaks on school days at 8am, before school starts.
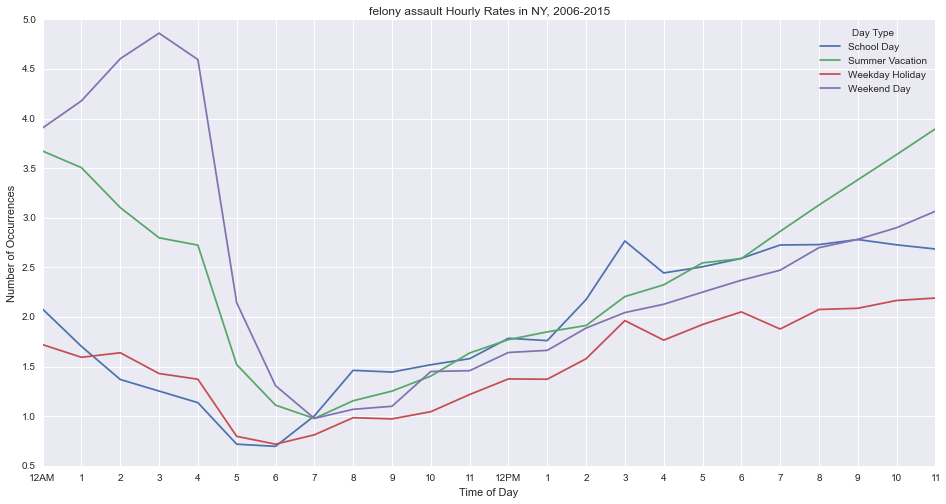
Felony assault peaks on weekend days at 3am.
Grand larceny tends to be higher on school days, with peaks at 8am, 12pm and 3pm.
Motor vehicle theft peaks at 10pm on summer nights.
Murder peaks at 4am on weekends.
Rape peaks at midnight.
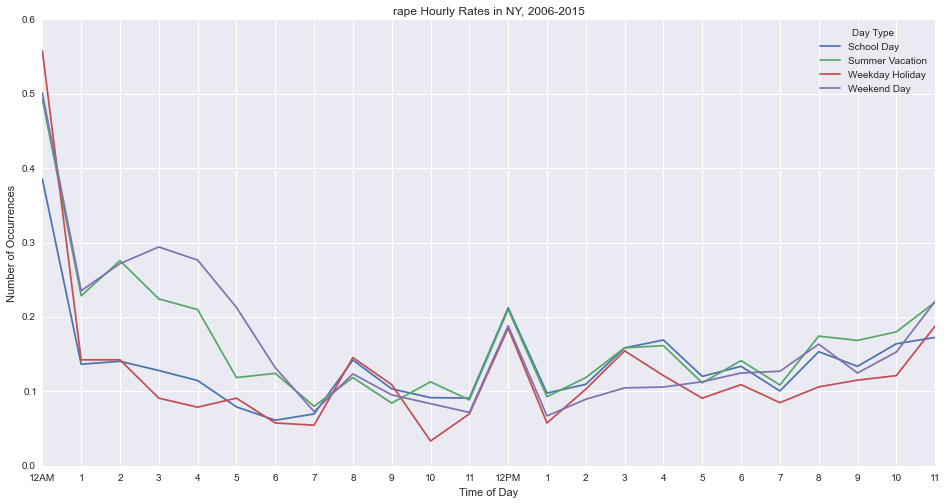
Some fascinating, albeit morbid, takeaways.
Which crimes happen most frequently?
So far we’ve looked at the varies types of crimes individually, but how to they compare to one another? To answer this question, we will perform another aggregate / groupby function to count the number of occurrences by Day Type and Offense Type.
# Define the aggregation calculations
aggregations = {
    'OBJECTID': { # work on the "OBJECT ID" column
        'num_occurrences': 'count'}  # get the count, and call this result 'num_occurences'
    }

# Perform groupby aggregation by occurrence hour and day type
c = df.groupby([df['Offense'].astype('str'), df['Day Type']]).agg(aggregations).unstack()

# Divide the num_occurrences columns by the appropriate number of days to convert them into daily rates
c[('OBJECTID', 'num_occurrences', 'School Day')] = c[('OBJECTID', 'num_occurrences', 'School Day')] / school_days
c[('OBJECTID', 'num_occurrences', 'Summer Vacation')] = c[('OBJECTID', 'num_occurrences', 'Summer Vacation')] / summer_days
c[('OBJECTID', 'num_occurrences', 'Weekday Holiday')] = c[('OBJECTID', 'num_occurrences', 'Weekday Holiday')] / weekday_holidays
c[('OBJECTID', 'num_occurrences', 'Weekend Day')] = c[('OBJECTID', 'num_occurrences', 'Weekend Day')] / weekend_days
c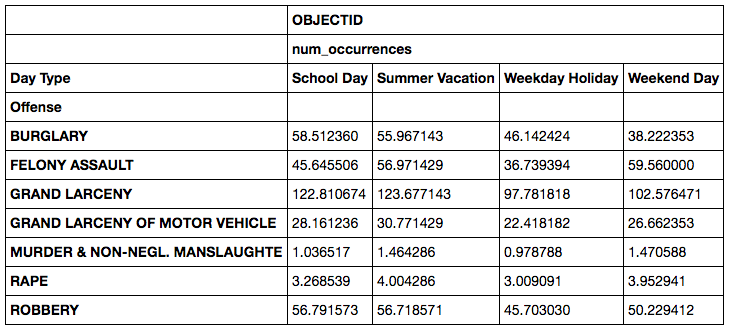
c.plot(kind='bar', figsize=(12,6), title='Daily Number of Felonies in NYC, 2006-2015');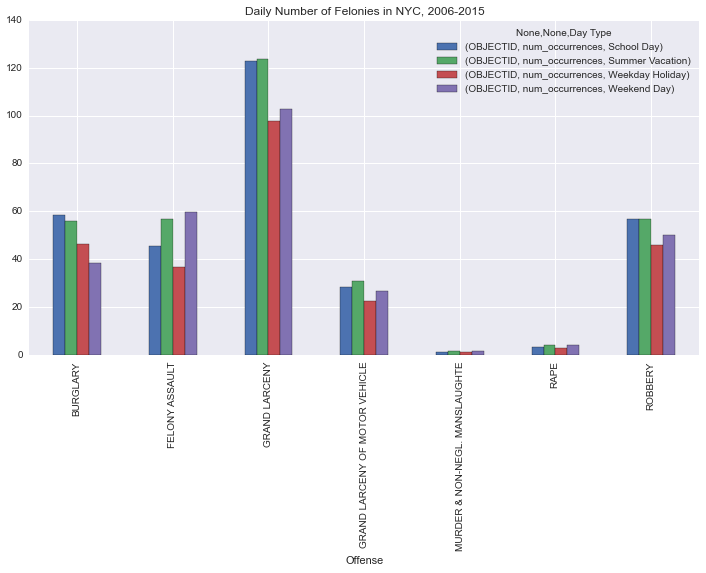
How have crime rates changed over time?
# Define the aggregation calculations
aggregations = {
    'OBJECTID': { # work on the "OBJECT ID" column
        'num_occurrences': 'count',  # get the count, and call this result 'num_occurences'
        'hourly_rate': 'count'} # placeholder for now - we will divide this by number of days next
    }

# Perform groupby aggregation by occurrence hour and day type
g = df.groupby([df['Offense'], df['Occurrence Hour'], df['Occurrence Year'].astype('str')]).agg(aggregations).unstack()

# Divide houry_rate columns by days
g[('OBJECTID', 'hourly_rate')] = g[('OBJECTID', 'hourly_rate')] / (days/10)
g.head()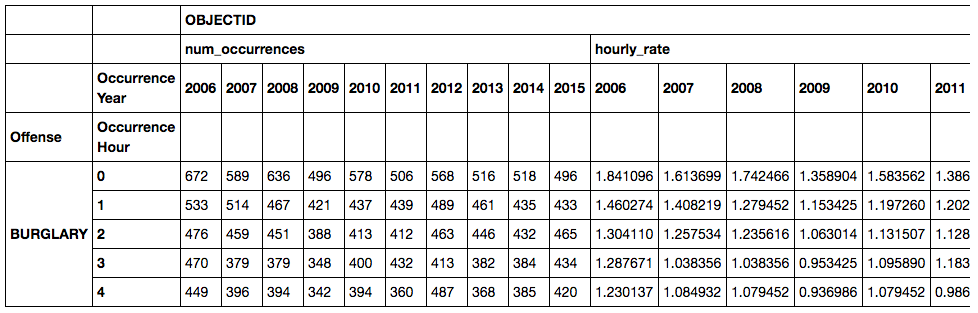
g.loc['ROBBERY',('OBJECTID', 'hourly_rate')].plot(figsize=(15,10), title='');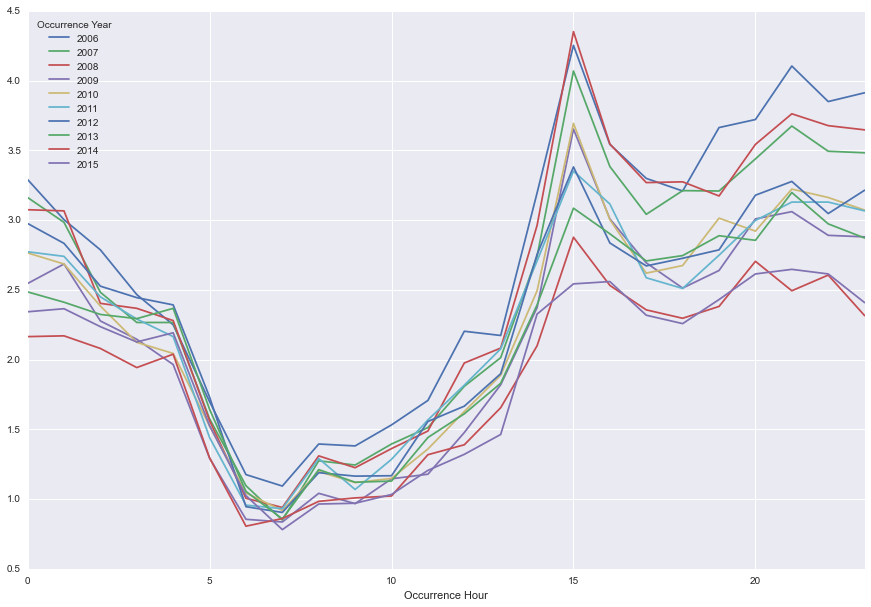
The good news: robbery is significantly lower in 2015 than 2006.